Quaderns de Psicologia | 2026, Vol. 28, Nro. 1, e2298 | ISSN: 0211-3481 | ![]()
 https://doi.org/10.5565/rev/qpsicologia.2298

Stanford Purpose Assessment: Psychometric Properties for the Brazilian Context
Evaluación Stanford del proyecto de vida: propiedades psicométricas para el contexto brasileño
David Moises Barreto dos Santos
State University of Feira de Santana
Douglas da Silveira Pereira
Independent researcher
Ulisses Ferreira de Araújo
University of São Paulo
ABSTRACT
In this study, we aim to validate the Stanford Purpose Assessment (SPA) within the Brazilian cultural context. With a diverse sample of 669 Brazilians aged 14–71, the research employed Exploratory Factor Analysis to delineate SPA’s structure, revealing a three-factor model: meaningful goal setting, beyond-the-self motivation, and engagement in goal realization. The instrument exhibited strong psychometric properties, with factor loadings spanning .39 to .92 and most reliability indices surpassing the 0.70 threshold, albeit engagement was around 0.5. Purpose dimensions positively correlated with presence of meaning and well-being facets, while inversely relating to depression, anxiety, and stress, underscoring the negative relationship between purpose and mental health challenges. These findings affirm SPA’s applicability across diverse age groups in Brazil, offering valuable insights for advancing purpose-centered research and interventions aimed at fostering positive human development. Additionally, results from Rasch analysis suggest that integrating more challenging items could enhance the instrument’s precision.
Keywords: Purpose; Validation study; Factor analysis; Rasch model.
RESUMEN
En este estudio buscamos validar la Stanford Purpose Assessment (SPA) en el contexto cultural brasileño. Participaron 669 brasileños de 14 a 71 años. Mediante Análisis Factorial Exploratorio se identificó un modelo de tres factores: establecimiento de metas significativas, motivación más allá del yo y compromiso con la realización de metas. El instrumento mostró sólidas propiedades psicométricas, con cargas factoriales entre .39 y .92 y la mayoría de los índices de confiabilidad por encima de 0.70, aunque el factor compromiso presentó valores cercanos a 0.5. Las dimensiones de proyecto de vida se correlacionaron positivamente con presencia de sentido y bienestar, y negativamente con depresión, ansiedad y estrés. Estos hallazgos confirman la aplicabilidad del SPA en diversos grupos etarios en Brasil y ofrecen valiosas perspectivas para la investigación sobre proyecto de vida y desarrollo humano positivo. El análisis de Rasch sugiere que incorporar ítems más desafiantes podría mejorar la precisión del instrumento.
Palavras-chave: Proyecto de vida; Estudio de validación; Análisis factorial; Modelo de Rasch.
INTRODUCTION
Decades of research underscore the critical role of purpose in fostering positive human development. Many authors have emphasized the central role of purpose (Bronk, 2014; Damon & Malin, 2020; Damon et al., 2003; Lukas, 1989; Lukas & Pintos, 2012; Malin, 2018). Kendall Bronk’s (2014) review of significant resilience models and developmental theories identifies purpose as a key driver of healthy human growth, linking it more with adaptive traits and abilities than the absence of problems. Purpose provides significant guidance and direction throughout life’s stages, influencing how individuals allocate time, energy, and psychological resources (Bronk, 2014).
Empirical evidence links purpose with various positive outcomes, showing that a meaningful life correlates with health-promoting attitudes and enhanced well-being. Conversely, a lack of purpose or existential crises correlates with risk behaviors, depression, quality of life impairment, substance use, and more (Brassai et al., 2011; Steger, 2018; Steger et al., 2014; Waters et al., 2021). Benefits extend to physical health, with positive associations noted in immunity, chronic pain, cholesterol levels, sleep disorders, obesity, and beyond (Czekierda et al., 2017; Fischer et al., 2023). A strong sense of purpose also motivates individuals to persevere through challenges (Damon, 2008; Damon et al., 2003; Frankl, 1984, 2012).
Given these outcomes and increasing scientific focus on purpose, specific instruments have been developed to capture this construct. In this study, we evaluate the psychometric properties of the Stanford Purpose Assessment (SPA) in the Brazilian population.
Multidimensional definition of purpose
The Stanford Purpose Assessment (SPA) draws from Damon et al.’s (2003) conception of purpose, defined as “a stable and generalized intention to accomplish something that is at once meaningful to the self and consequential to the world beyond the self” (p. 121). This understanding led to the identification of three key dimensions of purpose (Damon & Colby, 2022; Malin, 2018): firstly, a long-term goal that holds personal significance and is future-oriented; secondly, a motivation that extends beyond oneself, rooted in a deep desire to make a positive impact on the world; and thirdly, a commitment to actively pursue the desired goal through actions that require time, energy, and personal resources.
Measures of purpose
Measures of purpose have evolved from this multidimensional concept. Initially, purpose research focused on qualitative studies (Damon, 2008; Damon & Malin, 2020) using the Stanford Youth Purpose Interview Protocol (Stanford Center on Adolescence, 2021; Malin et al., 2014). However, the past decade has seen efforts to develop and validate quantitative instruments despite challenges in capturing dimensions such as beyond-the-self motivation (Bronk, 2014).
The Claremont Purpose Scale (CPS) emerged from adapting three existing measures of goal-directedness, personal meaning, and a beyond-the-self orientation (Bronk et al., 2018). The Sense of Purpose Scale (SOPS) features three subscales based on literature review and existing scales: awareness of purpose, awakening to purpose, and altruistic purpose (Sharma et al., 2018). Both the CPS and SOPS focus not on the content of purpose but on an individual’s disposition or sense of purpose.
The Measure of Adolescent Purpose (MAP) also assesses a three-dimensional structure but aims to capture intention, engagement, and prosocial reasoning based on participants’ written goals (Summers & Falco, 2020). The Stanford Purpose Assessment (SPA) (Malin, 2022), developed from the aforementioned interview protocol and refined to its current version, includes space for participants to write an important goal, reasons for its importance, and actions being taken towards it, similarly to MAP. It then features nine closed-ended questions evaluating agreement with items across three factors: the significance of the stated goal, the beyond-the-self motivation, and the engagement in pursuing the goal through concrete actions. However, to date, the SPA has only been validated in one study with an American sample, highlighting the need for further research.
International studies indicate that the content and trajectories of purpose are shaped by sociodemographic factors, sociocultural context, and family values (Damon & Malin, 2020). Brazil, in particular, is characterized by acute socioeconomic inequalities that significantly affect people’s quality of life and ways of living. Additionally, its vast size results in notable cultural and identity differences across regions. The availability of validated purpose instruments like the SPA could facilitate national research and provide greater insight into life projects within the Brazilian context. Given that the SPA has only been administered to a single sample and that this is the first time a psychometric tool based on Damon’s theory has been applied in Brazil, we have chosen a more cautious approach in this study, opting for an exploratory factor analysis.
METHOD
Translation and adaptation processes of SPA
The translation and adaptation process of the original SPA (v1) into Brazilian Portuguese followed multiple stages, aligned with international guidelines (Borsa et al., 2012; International Test Commission, 2017). Initially, two independent translators rendered the instrument into Portuguese. Two of the authors independently reviewed the translated items, seeking the most appropriate linguistic and cultural adjustments. They then compared their suggested adjustments, discussing and resolving any discrepancies. Ultimately, they produced a unified version (v2). This version underwent evaluation by two experts, leading to minor revisions (v3). Once again, two of the authors reviewed the evaluations and compared the modifications. Subsequently, the target population (N=12) reviewed it, prompting slight modifications (v4). The adapted version was then back-translated into English by two new translators, different from those in the initial phase. The researchers synthesized this feedback (v5) and compared it with the original version (v1). They deemed this version grammatically and semantically equivalent to the original and received approval from the original instrument’s author. The final version is available in Appendix A.
Participants and procedures
The sample comprised 669 participants (52.9% female), aged 14 to 71 years (M = 30.2, SD = 14.5), from 22 Brazilian states. Data were collected from two independent studies. The first sample consisted of 144 teachers (75.6% female, M = 45.3, SD = 8.6) enrolled in a teacher training on purpose. The second sample, with 525 participants, included: 1) the general population (N = 157, 58% female, M = 38.7, SD = 16.7); 2) university students (N = 261, 35.2% female, M = 22.1, SD = 4.4); 3) public school students (N = 107, 57.9% female, M = 18.2, SD = 6.8). The general population was recruited through an online email and social media survey, while students were recruited at their educational institutions. The final sample excluded participants with attention test failures (N = 29), blank responses (N = 151), and missing SPA data (N = 11). Ethical standards were upheld throughout the study, with approval from the Human Research Ethics Committee of the University of São Paulo (CAAE 69798423.0.0000.5390). All participants provided informed consent before data collection.
Measures
Participants in both studies completed the SPA, while those in the second study also responded to assessments concerning purpose, well-being, depression, anxiety, and stress levels.
Stanford Purpose Assessment (SPA). Developed by Heather Malin in 2022, the SPA is a mixed-method tool that includes three open-ended and nine closed-ended items. The open-ended items solicit narratives about a significant goal, why it is important, and steps being taken toward its achievement. The closed-ended items, rated on a 5-point Likert scale from 1 (completely disagree) to 5 (completely agree), evaluate three dimensions: meaning (e.g., “Doing this will give me a sense that my life has purpose”), beyond-the-self motivation (e.g., “My strongest motivation for doing this is a desire to do something good for the world”), and engagement (e.g., “In the past month, I have often taken action to accomplish this goal”). This investigation focuses exclusively on the closed-ended items.
Mental Health Continuum – Short Form (MHC-SF). The MHC-SF by Wagner de L. Machado and Denise R. Bandeira (2015) features 14 items that gauge well-being across three domains on a scale from 1 (never) to 6 (every day): emotional well-being (e.g., “Happy”), psychological well-being (e.g., “Likes own personality”), and social well-being (e.g., “Contribute to society”). As indicated in the original study conducted in Brazil, the score was calculated by summing the scores of all 14 items. In this study, the MHC-SF demonstrated excellent goodness-of-fit indices: CFI = .98; TLI = .97; RMSEA (90% CI) = .053 (.042 – .064); SRMR = .067. Cronbach’s alpha was .88.
Meaning in Life Questionnaire – Presence of Meaning (MLQ-P). Employing the MLQ-P’s 5-item subscale, participants rated their agreement from 1 (absolutely untrue) to 7 (absolutely true) on statements like “I understand my life’s meaning” (Damásio & Koller, 2015). The score was obtained by summing the values of the 5 items, one of which was reverse-scored. In this study, the MLQ demonstrated excellent goodness-of-fit indices: CFI = 1.00; TLI = 1.00; RMSEA (90% CI) = .000 (.000 – .041); SRMR = .016. Cronbach’s alpha was .89.
Depression Anxiety Stress Scale (DASS-21). The DASS-21, as adapted by Rose C. B. Vignola and Adriana M. Tucci (2014), uses a 4-point Likert scale to assess emotional distress across three 7-item subscales: depression (e.g., “I felt I wasn’t worth much as a person”), anxiety (e.g., “I felt I was close to panic”), and stress (e.g., “I found it difficult to relax”). The aggregate score for each subscale was calculated by summing the scores of the corresponding 7 items. In this study, the expected tri-factorial solution demonstrated excellent goodness-of-fit indices: CFI = 1.00; TLI = 1.00; RMSEA (90% CI) = .000 (.000 — .000); SRMR = .041. Cronbach’s alphas for depression, anxiety, and stress were .88, .84, and .87, respectively.
Analyses
Exploratory factor analysis
We conducted an Exploratory Factor Analysis (EFA) on the SPA using a polychoric correlation matrix and the Robust Diagonally Weighted Least Squares (RDWLS) method (Asparouhov & Muthén, 2010). We determined the number of factors to retain through Parallel Analysis with random data permutation (Timmerman & Lorenzo-Seva, 2011) and applied Robust Promin rotation (Lorenzo-Seva & Ferrando, 2019). We assessed the scale’s unidimensionality with Explained Common Variance (ECV), Unidimensional Congruence (UniCo), and Mean of Item Residual Absolute Loadings (MIREAL) (Ferrando & Lorenzo-Seva, 2018), expecting values above 0.85, 0.95, and below 0.30, respectively. We anticipated that these indicators would not be met for the SPA.
We evaluated model fit using chi-square (χ²), RMSEA, CFI, and TLI, aiming for a non-significant chi-square (p > 0.05), RMSEA below 0.08, and CFI and TLI above 0.90 (Brown, 2006). We compared one-dimensional and three-dimensional model fits using the Bayesian Information Criterion (BIC), with the lower BIC indicating the preferred model (Lorenzo-Seva et al., 2011).
We verified internal consistency with composite reliability, Cronbach’s alpha, and McDonald’s omega for the overall and specific factors, considering values above 0.7 acceptable. We assessed factor score estimate quality using the Factor Determinacy Index (FDI) and ORION marginal reliability (Ferrando & Lorenzo-Seva, 2018), with FDI values above 0.90 and ORION values above 0.80 indicating reliability. We evaluated factor stability with the H index, where values above 0.80 indicate a well-defined latent variable (Ferrando & Lorenzo-Seva, 2018). Using a range of indicators is crucial for establishing the validity of the instrument through diverse methods. We performed all referenced analyses in FACTOR version 12.04.04.
Convergent validity
For convergent validity, we assessed Pearson’s correlations between SPA scores and MLQ-P, MHC-SF, and DASS-21 scores from the second sample, expecting positive correlations with MLQ-P and MHC-SF scores and negative correlations with DASS-21 subscales, using JASP for computations. In this analysis, mirroring the final SPA sample selection process, we excluded all cases with attention test failures, blank responses, and missing data on external measures, resulting in a total of 424 participants.
Rasch Analysis
To assess the SPA’s psychometric properties, we applied the Rasch model for polytomous data (Andrich, 1978), based on Item Response Theory, using Winsteps version 5.1.4 (Linacre, 2023). This approach evaluates the latent trait level (θ) and item difficulty (δ), presenting results in log-odds units (logits). We investigated both person and item reliability, as well as deviations in performance, via infit and outfit metrics. We anticipated reliability indices to exceed 0.70 (Linacre, 2023). Infit and outfit indices analyze residuals for items relative to the model, with infit focusing on unexpected responses from individuals whose latent trait levels align with item difficulty, and outfit on responses from those whose trait levels deviate markedly from item difficulty. We evaluated these indices using mean square (MNSQ) and standardized z (ZSTD) values, aiming for an ideal MNSQ of 1. Values above 1 suggest greater variability than predicted by the Rasch model (misfit), while values below 1 indicate less variability (overfit). Typically, MNSQ values between 0.7 and 1.3 logits are acceptable, though a broader range of 0.5 to 1.5 logits may also be considered (Wright & Linacre, 1994). ZSTD values beyond |2| indicate a poor fit to the data.
RESULTS
Exploratory factor analysis
Bartlett’s sphericity test (2626.8, df = 36, p < 0.00001) and KMO measure (0.83) confirmed the interpretability of the item correlation matrix. Parallel analysis pointed to a single factor as the most representative of the data (refer to Table 1). Measures of Unidimensional Congruence (UniCo = 0.958 [95% CI = 0.839-0.983]) and Mean of Item Residual Absolute Loadings (MIREAL = 0.283 [95% CI = 0.242-0.320]) supported the data’s unidimensionality, despite the Explained Common Variance (ECV = 0.822 [95% CI = 0.798-0.853]) not doing so.
Table 1. Results of Parallel Analysis
Variable |
Real-data % of variance |
95 percentile of Random % of variance |
1 |
54.2573 |
27.6767 |
2 |
16.0225 |
23.0822 |
3 |
12.7974 |
19.1822 |
4 |
9.8813 |
15.9586 |
5 |
3.3465 |
13.3683 |
6 |
1.9635 |
10.8839 |
7 |
1.2986 |
8.5088 |
8 |
0.4329 |
5.4464 |
Note: The number of factors to retain is one, as only one factor from the actual data exhibits a percentage of explained variance greater than that of the random data.
This indication of unidimensionality led to the following fit indices for the model: χ2 = 311.855, df = 27; p < 0.05; RMSEA = 0.126 (95% CI = 0.010-0.141); CFI = 0.936 (95% CI = 0.915-0.961); TLI = 0.914 (95% CI = 0.886-0.948); BIC = 428.959 (95% CI = 324.667-506.907). The significant chi-square and the RMSEA’s indication of a poor model prompted us to evaluate a three-dimensional model, which presented acceptable fit indices: χ2 = 18.800, df = 12; p > 0.05; RMSEA = 0.029 (95% CI = 0.000-0.037); CFI = 0.998 (95% CI = 0.997-1.000); TLI = 0.995 (95% CI = 0.992-1.001); BIC = 253.008 (95% CI = 244.293-257.097). With all three-dimensional model indices being acceptable and the BIC lower than the unidimensional model, we adopted the multidimensional model in line with Malin (2022).
Table 2 details item factor loadings, internal reliability indices for each factor (composite reliability, Cronbach’s alpha, and McDonald’s omega), and factor score estimates for the representativeness of the latent trait and effectiveness of factor estimation (FDI), accuracy (Orion marginal reliability), and replicability (H-index). Items demonstrated suitable factor loadings, with values exceeding 0.3 on theoretically anticipated factors.
Table 2. Factorial structure of Stanford Purpose Assessment (SPA)
Items |
Meaning |
Beyond-the-self motivation |
Engagement |
spa1 |
0.062 |
0.866 |
−0.096 |
spa2 |
0.108 |
0.177 |
0.456 |
spa3 |
−0.048 |
0.793 |
0.164 |
spa4 |
0.594 |
0.104 |
0.026 |
spa5 |
0.017 |
0.931 |
−0.136 |
spa6 |
0.094 |
0.031 |
−0.389 |
spa7 |
−0.004 |
0.022 |
0.711 |
spa8 |
0.817 |
−0.068 |
0.108 |
spa9 |
0.921 |
−0.011 |
−0.101 |
Composite reliability |
0.828 |
0.899 |
0.531 (0.514*) |
Cronbach’s alpha |
0.745 |
0.841 |
0.451 (0.531*) |
McDonald’s omega |
0.754 |
0.843 |
0.506 (0.540*) |
H-latent |
0.875 |
0.908 |
0.684 (0.703*) |
H-observed |
0.672 |
0.804 |
0.623 (0.628*) |
FDI |
0.936 |
0.953 |
0.827 (0.838*) |
ORION |
0.875 |
0.908 |
0.684 (0.703*) |
Note: FDI = Factor Determinacy Index; ORION = Overall Reliability of fully-Informative prior Oblique N-EAP scores.
* Calculation excluding item **SPA6**.
While “meaning” and “beyond-the-self motivation” factors showed acceptable internal consistency indices, the “engagement” factor did not. The factor structure’s replicability (H-index; Ferrando & Lorenzo-Seva, 2018) indicated the potential non-replicability of the ‘engagement’ factor in future studies (H < 0.80). Furthermore, the FDI and Orion marginal reliability suggested that scores from this factor might lack reliability, possibly impacting its association with external measures. In contrast, the “meaning” and “beyond-the-self motivation” factors displayed satisfactory H-index, FDI, and Orion marginal reliability. After excluding item 6 from the instrument, recalculating indices improved all indices except composite reliability, yet not to acceptable levels.
Convergent validity
Our evaluation of convergent validity involved 424 participants who filled out external measures (refer to Table 3). In line with expectations, the three SPA factors correlated positively with presence of meaning (MLQ-P) and well-being (MHC-SF) and negatively with depression (DASS-21). However, while negative correlations of SPA factors with anxiety and stress were anticipated, only the “engagement” factor showed significant negative correlations. Notably, the significant negative correlation between meaning and anxiety was almost negligible.
Table 3. Correlation of the SPA subscales with MLQ-PS, MHC-SF, and DASS-21 (N = 424)
1 |
2 |
3 |
4 |
5 |
6 |
7 |
8 |
|
1. SPA-Mea |
- |
|||||||
2. SPA-BTS |
0.434* |
- |
||||||
3. SPA-Eng |
0.276* |
0.260* |
- |
|||||
4. MLQ-P |
0.276* |
0.367* |
0.366* |
- |
||||
5. MHC-SF |
0.274* |
0.366* |
0.385* |
0.713* |
- |
|||
6. DASS-D |
−0.110* |
−0.162* |
−0.304* |
−0.544* |
−0.579* |
- |
||
7. DASS-A |
−0.029** |
−0.086 |
−0.179* |
−0.352* |
−0.370* |
0.661* |
- |
|
8. DASS-S |
−0.060 |
−0.070 |
−0.194* |
−0.375* |
−0.347* |
0.683* |
0.751* |
- |
Note: SPA-Mea = meaning subscale; SPA-BTS = beyond-the-self subscale; SPA-Eng = engagement subscale; MLQ-P = Presence of Meaning subscale; MHC-SF = Mental Health Continuum – Short Form (wellbeing); DASS-D = Depression subscale; DASS-A = Anxiety subscale; DASS-S = Stress subscale; * p<0.01; ** p<0.05.
Considering the magnitude of these correlations is crucial (Cohen, 1977). The observed correlations ranged from weak (|0.10 – 0.30|) to moderate (|0.30 – 0.50|). Additionally, the three SPA factors exhibited positive intercorrelations.
Rasch Analysis
Since the engagement factor failed to achieve expected reliability and the factor correlations did not match anticipated magnitudes, we applied the Rasch model for polytomous data from Item Response Theory to assess item alignment. Table 4 details general reliability indicators for both persons and items for each factor, including item overall difficulty, separation index, reliability, and fit measures (infit and outfit). Reliability indices for the three factors were satisfactory for items (reliability > 0.81; separation index > 1.53) but not for persons, suggesting that the factor estimates might not replicate this sample’s latent trait level with a comparable instrument. The performance deviations (infit and outfit) indicated that the factors’ performance conformed to expected cutoffs.
Table 4. Rasch summary statistics for persons and items in the SPA subscales
Measure |
S.E. |
Separate |
Reliability |
Infit |
Outfit |
||||
MNSQ |
ZSTD |
MNSQ |
ZSTD |
||||||
Person |
Meaning |
2.40 |
1.34 |
0.48 |
0.19 |
0.93 |
0.00 |
0.93 |
0.00 |
BTS motivation |
1.68 |
1.19 |
1.46 |
0.68 |
0.96 |
−0.20 |
0.96 |
−0.10 |
|
Engagement |
0.77 |
0.83 |
0.84 |
0.41 |
0.98 |
−0.10 |
0.98 |
−0.30 |
|
Item |
Meaning |
0.00 |
0.07 |
5.47 |
0.97 |
1.01 |
0.20 |
0.93 |
−0.90 |
BTS motivation |
0.00 |
0.06 |
7.93 |
0.98 |
1.00 |
−0.10 |
0.96 |
−0.70 |
|
Engagement |
0.00 |
0.04 |
5.75 |
0.97 |
0.99 |
−0.20 |
0.98 |
−0.30 |
|
Note: S.E. = standard error; Separate = separation index; MNSQ = mean-square; ZSTD = z standardized.
However, when analyzing performance deviations for individual items, three items fell outside the anticipated cutoffs, as shown in Table 5, which also presents each item’s difficulty indicators. Item spa5 (BTS motivation) exhibited an overfit to the Rasch model, indicating a response pattern better than expected (Infit MNSQ = 0.86, ZSTD = −2.24; Outfit MNSQ = 0.86; ZSTD = −2.23). In contrast, items spa6 and spa2 from the engagement factor showed a misfit, indicating a more significant response variability than expected. This misfit was only evident in the infit for item spa2 (Infit MNSQ = 0.85, ZSTD = 2.68; Outfit MNSQ = 0.91; ZSTD = −1.52), while for item spa6, it appeared in both infit and outfit (Infit MNSQ = 1.15, ZSTD = 2.74; Outfit MNSQ = 1.11; ZSTD = 1.90).
Table 5. Estimates of item difficulty and fit statistics (infit and outfit) for the SPA.
Items |
Measure |
S.E. |
Infit |
Outfit |
|||
MNSQ |
ZSTD |
MNSQ |
ZSTD |
||||
Meaning |
spa8 |
0.43 |
0.06 |
0.92 |
−1.03 |
0.86 |
−1.87 |
spa4 |
0.10 |
0.07 |
1.14 |
1.70 |
1.08 |
0.96 |
|
spa9 |
−0.53 |
0.08 |
0.98 |
−0.17 |
0.85 |
−1.68 |
|
BTS motivation |
spa5 |
0.50 |
0.06 |
0.86 |
−2.24 |
0.86 |
−2.23 |
spa3 |
0.20 |
0.06 |
1.08 |
1.26 |
1.05 |
0.77 |
|
spa1 |
−0.70 |
0.07 |
1.04 |
0.65 |
0.96 |
−0.53 |
|
Engagement |
spa6 |
0.35 |
0.04 |
1.15 |
2.74 |
1.11 |
1.90 |
spa7 |
−0.11 |
0.04 |
0.97 |
−0.56 |
0.93 |
−1.18 |
|
spa2 |
−0.25 |
0.04 |
0.85 |
−2.68 |
0.91 |
−1.52 |
|
Note: S.E. = standard error; MNSQ = mean-square; ZSTD = z standardized.
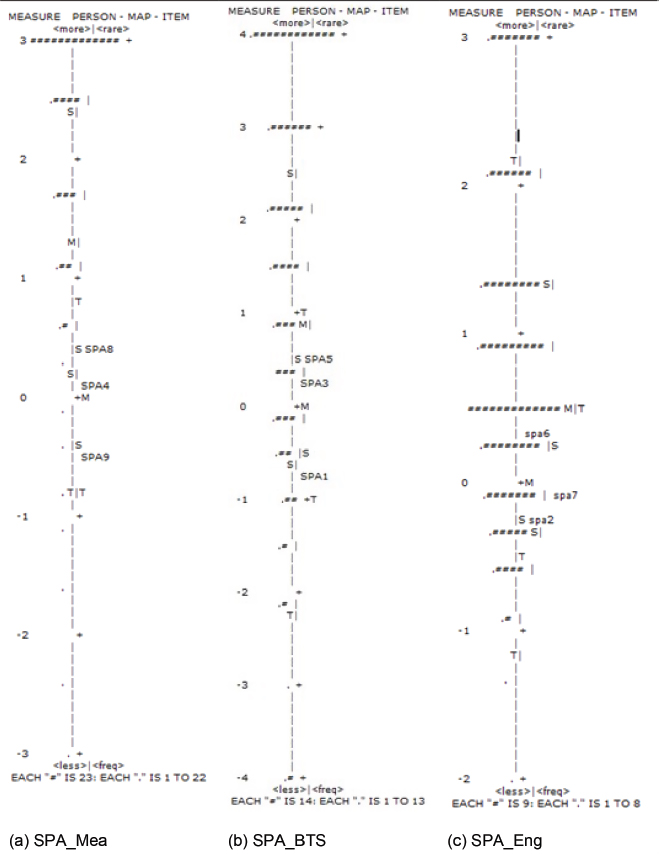
Additionally, the items’ difficulty exceeded the latent trait level, as the mean theta for all three factors was higher than the mean item difficulty (item location). This discrepancy is more apparent in Figure 1(a-c), which displays the item-person map for each factor. Generally, item difficulty did not exceed 0.5 logits, whereas most participants’ latent traits ranged from 0 to +4 logits. The meaning factor, depicted in Figure 1(a), showed the most significant discrepancy between theta and delta and, accordingly, the lowest person reliability index, as indicated in Table 4.
Figure 1. Item–person map of the subscales meaning, beyond-the-self motivation, and engagement
DISCUSSION
This research aimed to adapt the SPA culturally for the Brazilian setting and to evaluate its psychometric properties. Through parallel analysis, the initial exploratory analysis indicated a unifactorial structure with a poor fit, as reflected by the RMSEA (> 0.10), whereas a tri-factorial structure showed better CFI, TLI, and BIC values. The tri-factorial structure, showing acceptable fit indices and positive inter-factor correlations, aligns with previous qualitative research on Brazilian youth (Arantes & Pinheiro, 2021) and studies from other countries (Veazey et al., 2023; Wang et al., 2023), further validating the SPA structure across a broader age range beyond American youth.
Reliability indices (composite reliability, Cronbach’s alpha, and McDonald’s omega), factor score estimate quality (FDI and ORION), and factor stability (H index) presented in Table 2 were satisfactory for the meaning and beyond-the-self motivation factors but not for engagement. The removal of item 6, a reverse-scored item with the lowest factor loading, after confirmatory factor analysis in the original study (Malin, 2022), highlights the ongoing debate over reverse-scored items (Wang et al., 2023). Recalculating indices without item 6 improved all except composite reliability, yet the engagement factor’s robustness remained insufficient.
The engagement factor, alongside the others, correlated positively with the purpose (MLQ-P) and well-being (MHC-SF) and negatively with depression (DASS21-D), consistent with other research (Suldo et al., 2021; Veazey et al., 2023; Wang et al., 2023). The engagement factor distinctively associates with anxiety and stress, a characteristic not found in the other two factors, contrasting with results from other studies (Veazey et al., 2023; Wang et al., 2023). Due to their inherent connection, the expected strong correlation between SPA’s meaning factor and MLQ-P and MHC-SF was only moderate, suggesting an area for further exploration. Additionally, the SPA’s meaning factor should have shown a strong correlation (> 0.5) with MLQ-P and MHC-SF, rather than a moderate one, given the deep connection between meaning and well-being (Steger, 2017). For instance, the correlation between MLQ-P and MHC-SF in this study was 0.713.
Rasch model analysis for polytomous data, grounded in Item Response Theory, generally indicated the necessity for more challenging items to adequately assess higher latent purpose traits, particularly within the meaning factor. This necessitates a review and potential revision of items to represent the spectrum of purpose perceptions more comprehensively, or the inclusion of additional items spanning a broader difficulty range. This recommendation aligns with Brown’s (2006) guidance that a robust factor in a multifactorial structure should comprise more than two or three items. The SPA currently includes only three items per factor. Notably, two items within the engagement factor exhibited significant variability, warranting careful consideration for potential revision. Specifically, item 6, a reverse-scored item, could be restructured according to existing literature guidelines (Wang et al., 2023).
In summary, the SPA shows a promising structure but highlights areas for enhancement to capture latent purpose traits more effectively. The beyond-the-self motivation factor consistently performed well, while the meaning factor required more challenging items, and the engagement factor showed structural weaknesses, indicating possible variability in future research.
Limitations include using a non-probabilistic sample, raising Type I error risks. Although robust strategies were employed, larger probabilistic samples are essential for validating findings. The easier nature of the items calls for including more challenging items. Lastly, this study’s reliance on variable-centered analysis, as opposed to the original study’s person-centered approach (Malin, 2022), suggests that incorporating person-centered analysis could offer additional insights by identifying and comparing respondent groups.
CONCLUSION
The SPA, a self-report tool, evaluates purpose using nine items across a tri-factorial structure that includes meaningful goals, beyond-the-self motivation, and engagement in goal realization. This research utilized exploratory factor analysis, several indices, and item response theory to assess the psychometric characteristics of the SPA’s Brazilian Portuguese version, representing the inaugural exploration of the SPA’s psychometric properties in a non-U.S. sample. The findings indicate that the SPA could be a useful tool for assessing purpose across diverse age groups in Brazil, with significant theoretical and practical ramifications. Theoretically, in this work we deepen the understanding of the tri-dimensional construct of purpose and confirm the consensus regarding this structure. Practically, it provides a resource to broaden purpose studies in Brazil. However, further research is required to address certain limitations identified in the instrument, particularly within the engagement dimension. This may involve adding new items or revising existing ones to improve reliability and applicability in diverse settings.
REFERENCES
Andrich, David. (1978). A rating formulation for ordered response categories. Psychometrika, 43(4), 561–573.
Arantes, Valeria A., & Pinheiro, Viviane P. G. (2021). Purposes in life of young Brazilians: Identities and values in context. Estudos de Psicologia, 38, e200012. https://doi.org/10.1590/1982-0275202138e200012
Asparouhov, Tihomir, & Muthén, Bengt. (2010). Simple second order chi-square correction. Mplus Technical Appendix. https://www.statmodel.com/download/WLSMV_new_chi21.pdf
Brassai, László; Piko, Bettina F., & Steger, Michael F. (2011). Meaning in life: Is it a protective factor for adolescents’ psychological health? International Journal of Behavioral Medicine, 18(1), 44–51. https://doi.org/10.1007/s12529-010-9089-6
Borsa, Juliane C.; Damásio, Bruno F., & Bandeira, Denise R. (2012). Cross-cultural adaptation and validation of psychological instruments: Some considerations. Paidéia (Ribeirão Preto), 22(53), 423–432. https://doi.org/10.1590/S0103-863X2012000300014
Bronk, Kendall C. (2014). Purpose in life: A critical component of optimal youth development. Springer Science & Business Media.
Bronk, Kendall C.; Riches, Brian R., & Mangan, Susan A. (2018). Claremont Purpose Scale: A measure that assesses the three dimensions of purpose among adolescents. Research in Human Development, 15(2), 101–117. https://doi.org/10.1080/15427609.2018.1441577
Brown, Timothy A. (2006). Confirmatory factor analysis for applied research. The Guilford Press.
Cohen, Jacob. (1977). Statistical power analysis for the behavioral sciences. Academic Press.
Czekierda, Katarzyna; Banik, Anna; Park, Crystal L., & Luszczynska, Aleksandra. (2017). Meaning in life and physical health: Systematic review and meta-analysis. Health Psychology Review, 11(4), 387–418. https://doi.org/10.1080/17437199.2017.1327325
Damásio, Bruno F., & Koller, Silvia H. (2015). Meaning in Life Questionnaire: Adaptation process and psychometric properties of the Brazilian version. Revista Latinoamericana de Psicologia, 47(3), 185–195. https://doi.org/10.1016/j.rlp.2015.06.004
Damon, William. (2008). The path to purpose: Helping our children find their calling in life. The Free Press.
Damon, William, & Colby, Anne. (2022). Education for a purposeful life. In Marcelo Suarez-Orozco & Carola Suarez-Orozco (Orgs.), Education: A global compact for a time of crisis (pp. 181–193). Columbia University Press.
Damon, William, & Malin, Heather. (2020). The development of purpose: An international perspective. In The Oxford handbook of moral development (pp. 109–127). Oxford University Press.
Damon, William; Menon, Jenni, & Bronk, Kendall C. (2003). The development of purpose during adolescence. Applied Developmental Science, 7(3), 119–128. https://doi.org/10.1207/S1532480XADS0703_2
Ferrando, Pere J., & Lorenzo-Seva, Urbano. (2018). Assessing the quality and appropriateness of factor solutions and factor score estimates in exploratory item factor analysis. Educational and Psychological Measurement, 78(5), 762–780. https://doi.org/10.1177/0013164417719308
Fischer, Ian C.; Feldman, David B.; Tsai, Jack; Harpaz-Rotem, Ilan; McCutcheon, Victoria E.; Schulenberg, Stefan E., & Pietrzak, Robert H. (2023). Purpose in life and physical health in older U.S. military veterans: Cross-sectional results from the National Health and Resilience in Veterans Study. Preventive Medicine, 170, 107495. https://doi.org/10.1016/j.ypmed.2023.107495
Frankl, Viktor E. (1984). Man’s search for meaning. Pocket Books.
Frankl, Viktor E. (2012). The doctor and the soul: From psychotherapy to logotherapy. Souvenir Press.
International Test Commission. (2017). The ITC guidelines for translating and adapting tests (2nd ed.).
Linacre, John M. (2023). Winsteps® Rasch measurement computer program user’s guide (Versión 5.1.4). Winsteps.
Lorenzo-Seva, Urbano, & Ferrando, Pere J. (2019). Robust Promin: A method for diagonally weighted factor rotation. Liberabit: Revista Peruana de Psicología, 25(1), 99–106. http://dx.doi.org/10.24265/liberabit.2019.v25n1.08
Lorenzo-Seva, Urbano; Timmerman, Marieke E., & Kiers, Henk A. L. (2011). The hull method for selecting the number of common factors. Multivariate Behavioral Research, 46(2), 340–364. https://doi.org/10.1080/00273171.2011.564527
Lukas, Elisabeth. (1989). Logoterapia: A força desafiadora do espírito. Edições Loyola.
Lukas, Elisabeth, & Pintos, Claudio C. G. (2012). De la vida fugaz. Ediciones LAG.
Machado, Wagner de L., & Bandeira, Denise R. (2015). Positive Mental Health Scale: Validation of the Mental Health Continuum - Short Form. Psico-USF, 20(2), 259–274. https://doi.org/10.1590/1413-82712015200207
Malin, Heather. (2018). Teaching for purpose: Preparing students for lives of meaning. Harvard Education Press.
Malin, Heather. (2022). Engaging purpose in college: A person-centered approach to studying purpose in relation to college experiences. Applied Developmental Science, 27(1), 83–98. https://doi.org/10.1080/10888691.2022.2033120
Malin, Heather; Reilly, Timothy S.; Quinn, Brandy, & Moran, Seana. (2014). Adolescent purpose development: Exploring empathy, discovering roles, shifting priorities, and creating pathways. Journal of Research on Adolescence, 24(1), 186–199. https://doi.org/10.1111/jora.12051
Sharma, Gitima; Yukhymenko-Lescroart, Mariya, & Kang, Zi. (2018). Sense of Purpose Scale: Development and initial validation. Applied Developmental Science, 22(3), 188–199. https://doi.org/10.1080/10888691.2016.1262262
Stanford Center on Adolescence. (2021). Youth Purpose Interview (Version 2) [Unpublished instrument]. Stanford, CA.
Steger, Michael F. (2017). Meaning in life and wellbeing. In Mike Slade, Lindsay Oades, & Aaron Jarden (Orgs.), Wellbeing, recovery and mental health (pp. 75–85). Cambridge University Press.
Steger, Michael F. (2018). Meaning and well-being. In Ed Diener, Shigehiro Oishi, & Louis Tay (Orgs.), Handbook of well-being. DEF Publishers.
Steger, Michael F.; Fitch-Martin, Arissa R.; Donnelly, Jena, & Rickard, K. M. (2014). Meaning in Life and Health: Proactive health orientation links meaning in life to health variables among American undergraduates. Journal of Happiness Studies, 16(3), 583–597. https://doi.org/10.1007/s10902-014-9523-6
Suldo, Shannon M.; Mariano, Jenni M., & Gilfix, Hannah. (2021). Promoting students’ positive emotions, character, and purpose. In Fostering the emotional well-being of our youth: A school-based approach (pp. 282–312). Oxford University Press. https://doi.org/10.1093/med-psych/9780190918873.003.0015
Summers, Jessica J., & Falco, Lia D. (2020). The development and validation of a new measure of adolescent purpose. Journal of Experimental Education, 88(1), 47–71. https://doi.org/10.1080/00220973.2019.1575178
Timmerman, Marieke E., & Lorenzo-Seva, Urbano. (2011). Dimensionality assessment of ordered polytomous items with parallel analysis. Psychological Methods, 16(2), 209–220. https://doi.org/10.1037/A0023353
Veazey, Lillie G.; Weber, Marcela C., & Schulenberg, Stefan E. (2023). A psychometric validation of the Claremont Purpose Scale with an emerging adult university student population. Journal of Prevention and Health Promotion, 4(2), 200–222. https://doi.org/10.1177/26320770231171020
Vignola, Rose C. B., & Tucci, Adriana M. (2014). Adaptation and validation of the depression, anxiety and stress scale (DASS) to Brazilian Portuguese. Journal of Affective Disorders, 155, 104–109. https://doi.org/10.1016/j.jad.2013.10.031
Wang, Tong; Ye, Yu Q., & Zeng, Xiao Y. (2023). Psychometric evaluation of the Chinese version of the Claremont Purpose Scale among youth. Journal of Personality Assessment, 105(1), 48–57. https://doi.org/10.1080/00223891.2022.2032102
Waters, Lea; Algoe, Sara B.; Dutton, Jane; Emmons, Robert; Fredrickson, Barbara L.; Heaphy, Emily; Moskowitz, Judith T.; Neff, Kristin; Niemiec, Ryan; Pury, Cynthia, & Steger, Michael. (2021). Positive psychology in a pandemic: Buffering, bolstering, and building mental health. Journal of Positive Psychology, 17(3), 303–323. https://doi.org/10.1080/17439760.2021.1871945
Wright, Ben D., & Linacre, John M. (1994). Reasonable mean-square fit values. Rasch Measurement Transactions, 8, 370–371.
APPENDIX A: QUESTIONÁRIO STANFORD DE PROJETO DE VIDA
- Reflita sobre as coisas importantes que você quer fazer na sua vida. Em poucas palavras, descreva um objetivo que deseja realizar e que é muito significativo para você.
———————————————————————————————————————————
- Descreva de forma breve por que você deseja alcançar esse objetivo.
———————————————————————————————————————————
- Se você está atualmente fazendo algo para atingir esse objetivo, descreva brevemente o que você está fazendo.
———————————————————————————————————————————
Por favor, considerando agora APENAS o objetivo citado, indique o quanto você concorda ou discorda das afirmações abaixo, usando uma escala de 1 a 5, onde 1 significa “discordo totalmente” e 5 “concordo totalmente.
- Um motivo importante para eu querer fazer isso é para que a minha vida contribua com algo positivo no mundo.
- No meu tempo livre, eu frequentemente faço coisas que me ajudarão a alcançar esse objetivo.
- Eu quero fazer isso porque combina os meus pontos fortes com algo que o mundo necessita.
- Fazer isso me dá a sensação de que a minha vida tem sentido.
- Minha maior motivação para fazer isso é o desejo de fazer algo bom pelo mundo.
- Eu ainda não tenho certeza de quais passos tenho que dar para alcançar esse objetivo.
- No mês passado, frequentemente fiz coisas para alcançar esse objetivo.
- Esse objetivo diz muito sobre quais são os meus valores mais importantes.
- Esse objetivo representa o tipo de pessoa que eu quero ser agora e no futuro.
DAVID MOISES BARRETO DOS SANTOS
Full Professor at the State University of Feira de Santana and leader of the Meaning in Life Lab. Holds a Ph.D. in Knowledge Diffusion from the Federal University of Bahia (UFBA). His main research interests focus on purpose and meaning in life, meaningcentered education and professional teacher development.
davidmbs@uefs.br
https://orcid.org/0000-0002-7906-2073
DOUGLAS DA SILVEIRA PEREIRA
Holds a Ph.D. in Education from the University of São Paulo (USP), with a research exchange period at the University of Milan (UNIMIA). His research interests focus on happiness, well-being, and the intersections between psychology and culture.
douglasspereira@gmail.com
https://orcid.org/0000-0001-6651-3536
ULISSES FERREIRA DE ARAÚJO
Full Professor at the University of São Paulo, is President of the PAN-PBL: Association of PBL and Active Learning Methodologies. Holds a Ph.D. in Psychology from USP and has been a visiting professor at the universities of Harvard and Stanford (USA), Northeast Normal University (China), and Universidad Autónoma de Barcelona.
uliarau@usp.br
https://orcid.org/0000-0002-2955-8281
CITATION
Santos, David M. B.; Pereira, Douglas, & Araújo, Ulisses F. (2026). Stanford Purpose Assessment: Psychometric Properties for the Brazilian Context. Quaderns de Psicologia, 28(1), e2298. https://doi.org/10.5565/rev/qpsicologia.2298
EDITORIAL HISTORY
Received: 17-3-2025
Accepted: 30-9-2025
Published: 25-04-2026